
Technical Analysis Academy – How Confirmation Called the June 16, 2022 Bottom
Use this strategy to increase the odds of success on your next trade

This strategy is as close as TA followers can get to the Holy Grail of trading… And that’s looking for confirmation in different sets of charts.
Confirmation can come in several different forms. But the most important confirmation for stocks (yes crypto is different) comes from finding buy signals on several different time frames.
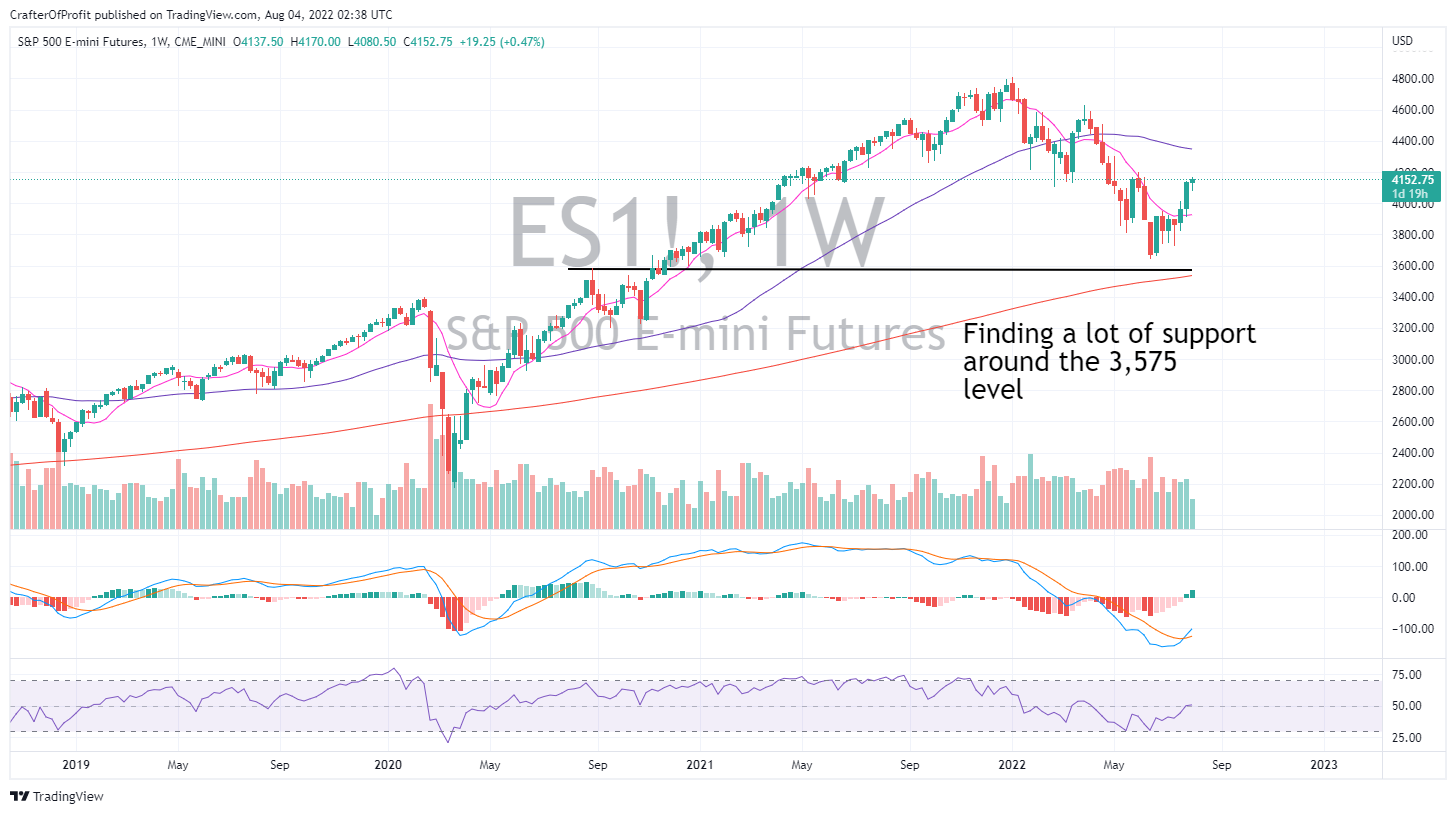
How do I do this? I start by looking at the daily (or weekly) chart for the overall trend and look for price support and resistance levels. As the market pulled back this year, I had a couple major points where I was looking for price to find support… And potentially make a big move higher.
In this case, I needed to use the weekly chart to go back to highs in August 2020. These were a point of resistance on the way up. And often resistance becomes support on the way down.
As you can see here, I found a lot of support at the 3,575 level on the S&P 500 Index, as shown by the E-mini Futures (ES). And when the market gets close to these levels, we need to start looking for reversal signals.
As we can see on the daily chart, several reversal signals began showing around the ides of June. The first is a positive divergence with the MACD. That’s when the price of a security makes a lower low, but the MACD indicator makes a higher low… A fairly reliable bottom indicator. The other is a doji candle – it looks like a spinning top.
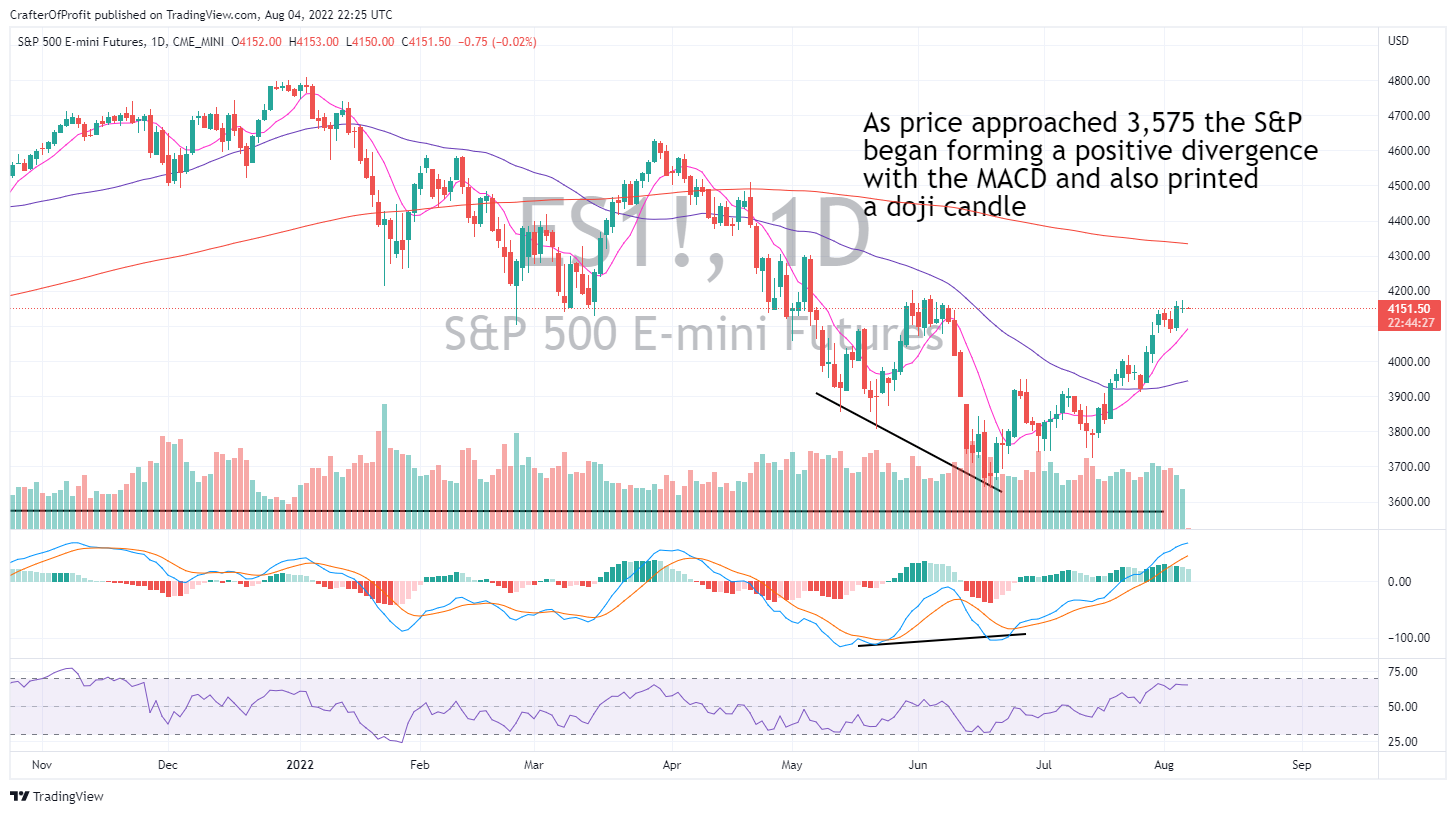
So we should be have been prepared then to establish a long position. But to get the timing exactly right, you should look for confirmation from other time periods.
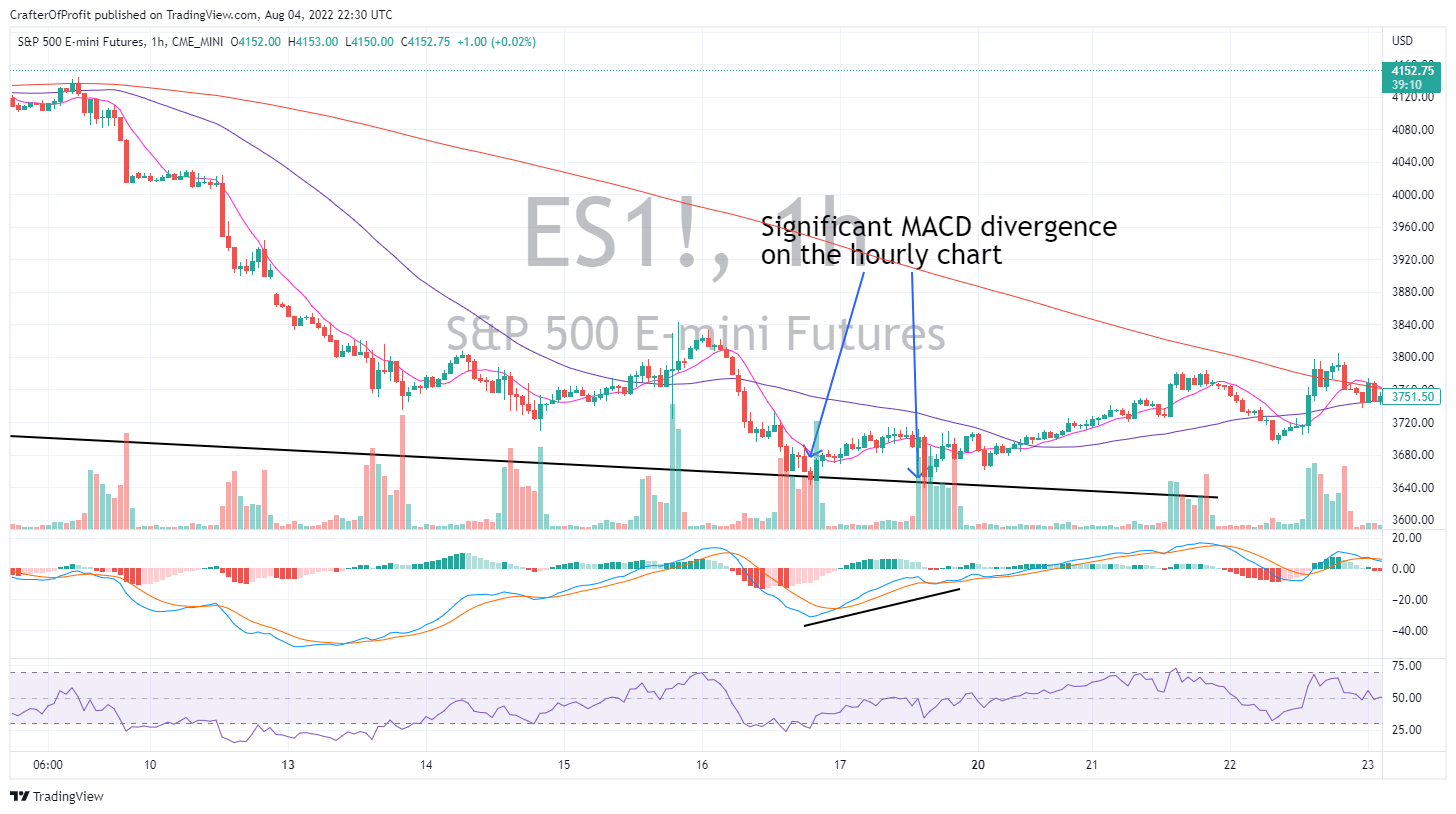
And we got that in both the hourly chart and 15-minute chart.
First let’s look at the hourly chart. Here we can see a massive positive divergence in the price action on the 16th and 17th. This was a huge buying signal… And confirmed as the market shot higher on the 17th.
And then on the 16th we saw the MACD diverge as well on the 15-minute chart…
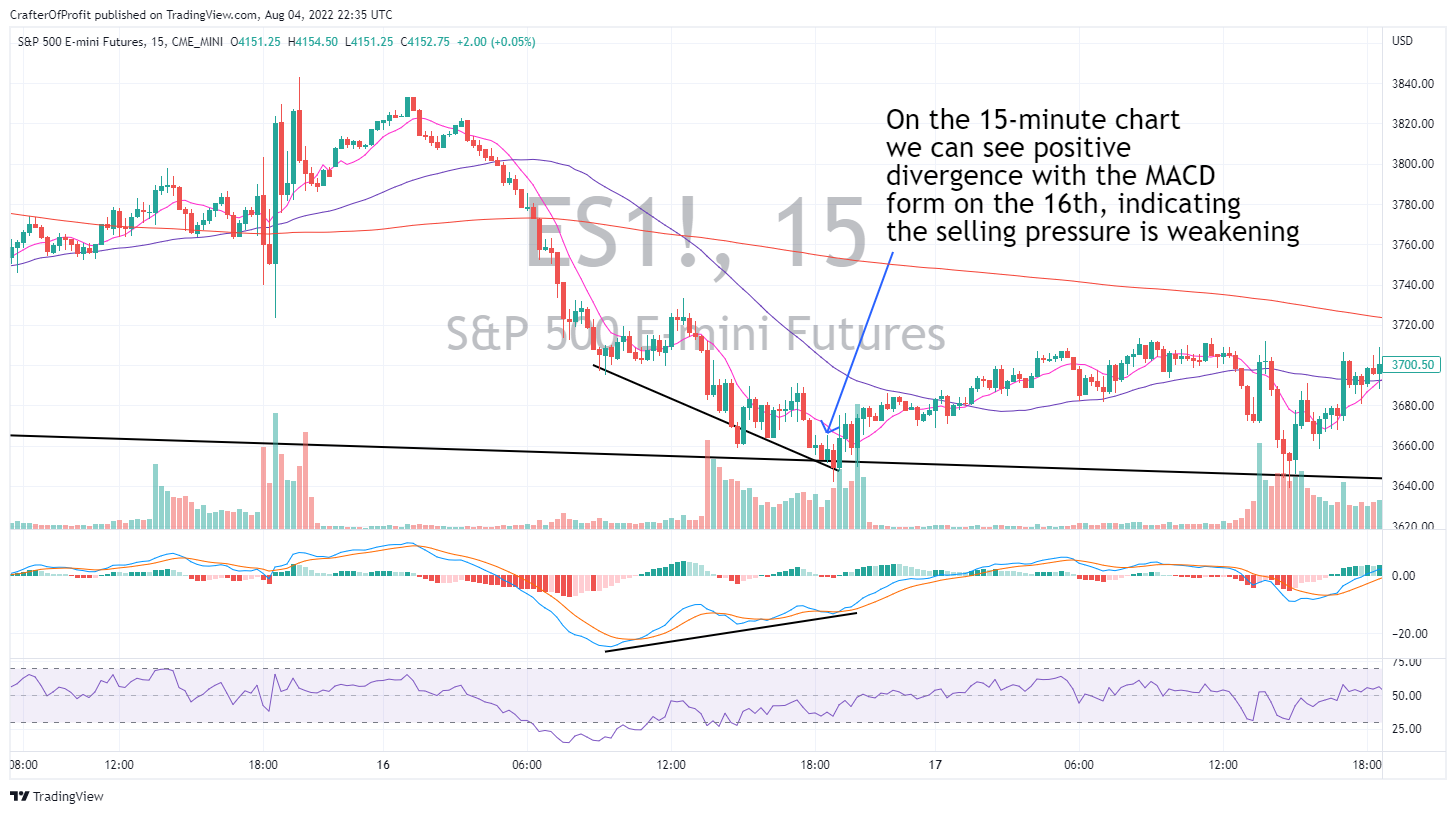
So now we have buy signals forming on 3 different charts. So we have traders looking at all these charts piling into the markets. This helps put the odds in our favor.
Often times if we only see the price confirmation on one chart, it will be a false signal… And you could be fighting against traders who see a sell signal on other time periods.
This increases the chances you get shaken out of a position as the market pulls back.
And another type of confirmation comes from other indices (or stocks) showing a similar trading pattern.
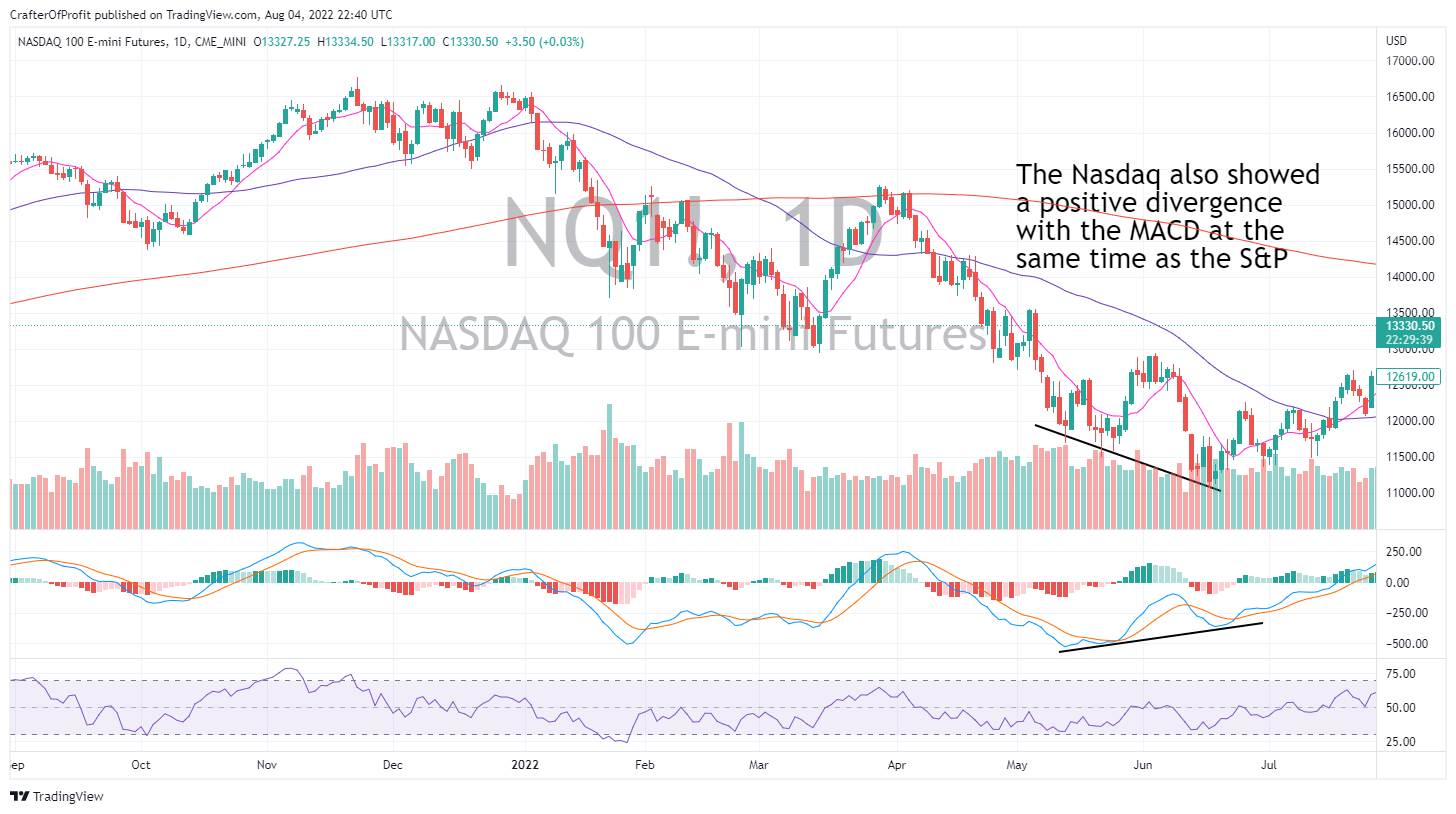
As we can see below, the Nasdaq also showed a positive divergence signal at the same time as the S&P. This increased our odds even further on a major turning point in the market.
This simple strategy puts the odds of a landing a successful trade in your favor. It just takes an extra minute to go through a couple extra charts.
This strategy can also be used with individual stocks. If you are thinking about buying a company like Microsoft because it has a great looking chart, you should also make sure the Technology ETF (XLK) and Nasdaq charts look strong as well.
A majority of the movement of a stock is based upon the performance of the index or sector it’s in. So don’t fight the overall trend… You might get lucky, but the odds won’t be in your favor.
Before placing your next trade, make sure you see confirmation in different time periods.
And in a future article, I’ll show you a unique confirmation found in the cryptocurrency markets.